Category Archives: Ubiquiti

Evaluating the world of WAN link-load-balancing (SD-WAN)

It is probably obvious from the postings I’ve made here at BraindeadProjects that my home is nothing more than a giant networking lab. When I wanted to learn how GPON worked, I prepped my “lab” by building a 12 strand fiber-optic ring through the walls of my home and connecting the five Cisco switches throughout the house together using bi-directional SFPs

12 strands of fiber-optic and some kevlar blonde hair

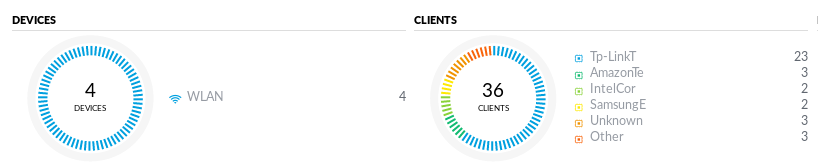
When I needed better wireless coverage, I built out a Ubiquiti Unifi wireless network and later rewired most of the light switches in my home with Wifi-enabled TP-Link switches so that I could voice control the home using Amazon Alexa Echo’s.

The Ubiquiti UniFi Controller

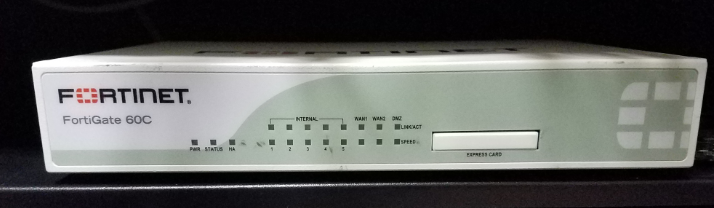
Wanting to centralize my firewall policies, long ago I routed each of the 12 production VLANs at home run through a Fortigate 60C High Availability cluster.

Buy what you need, not necessary what’s new.

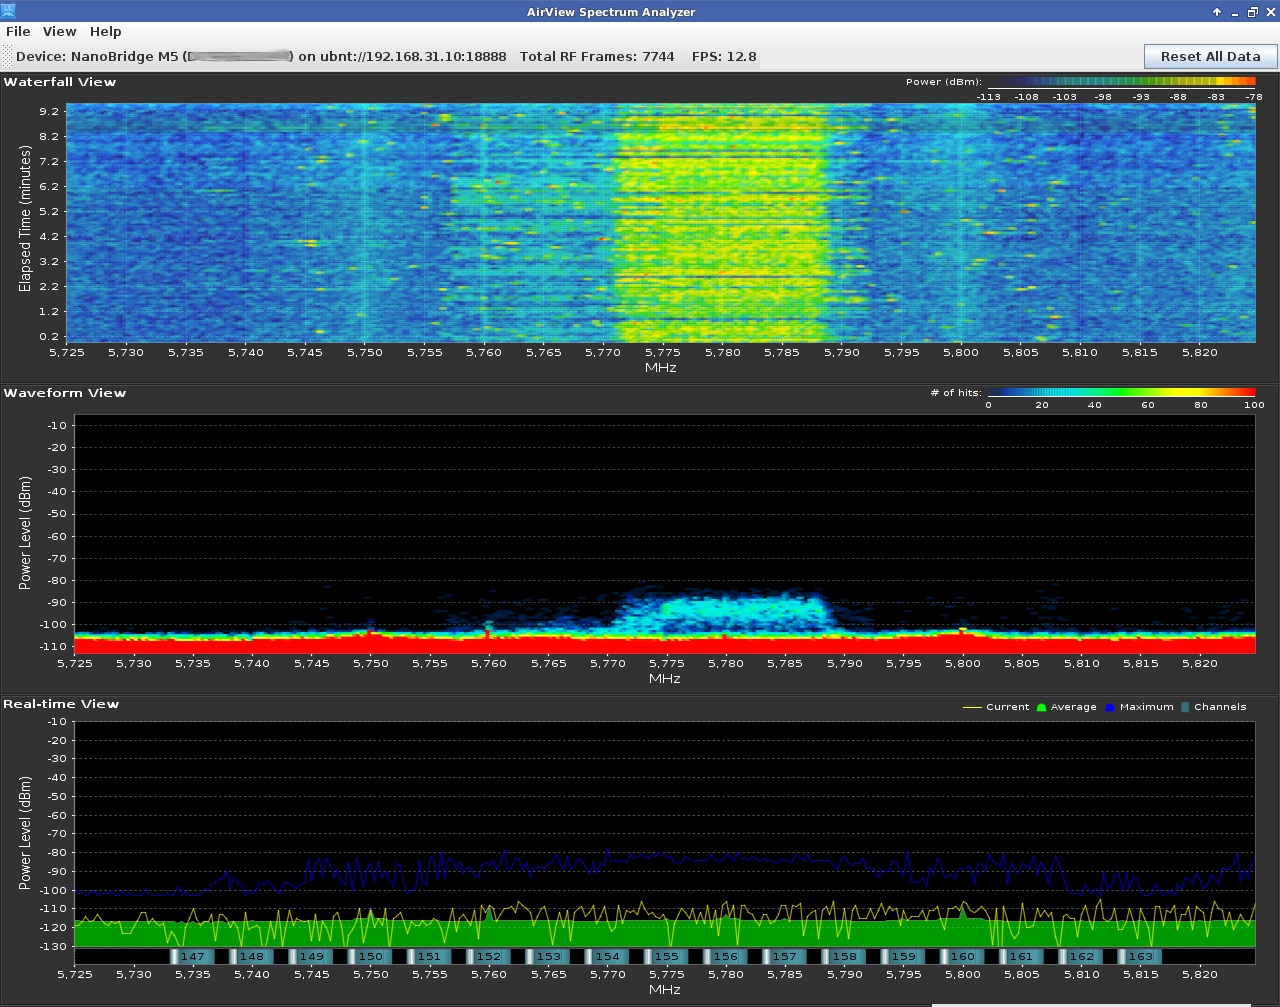
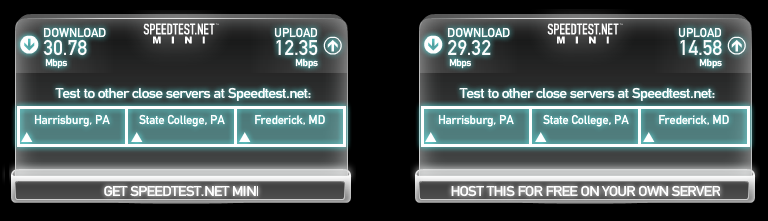
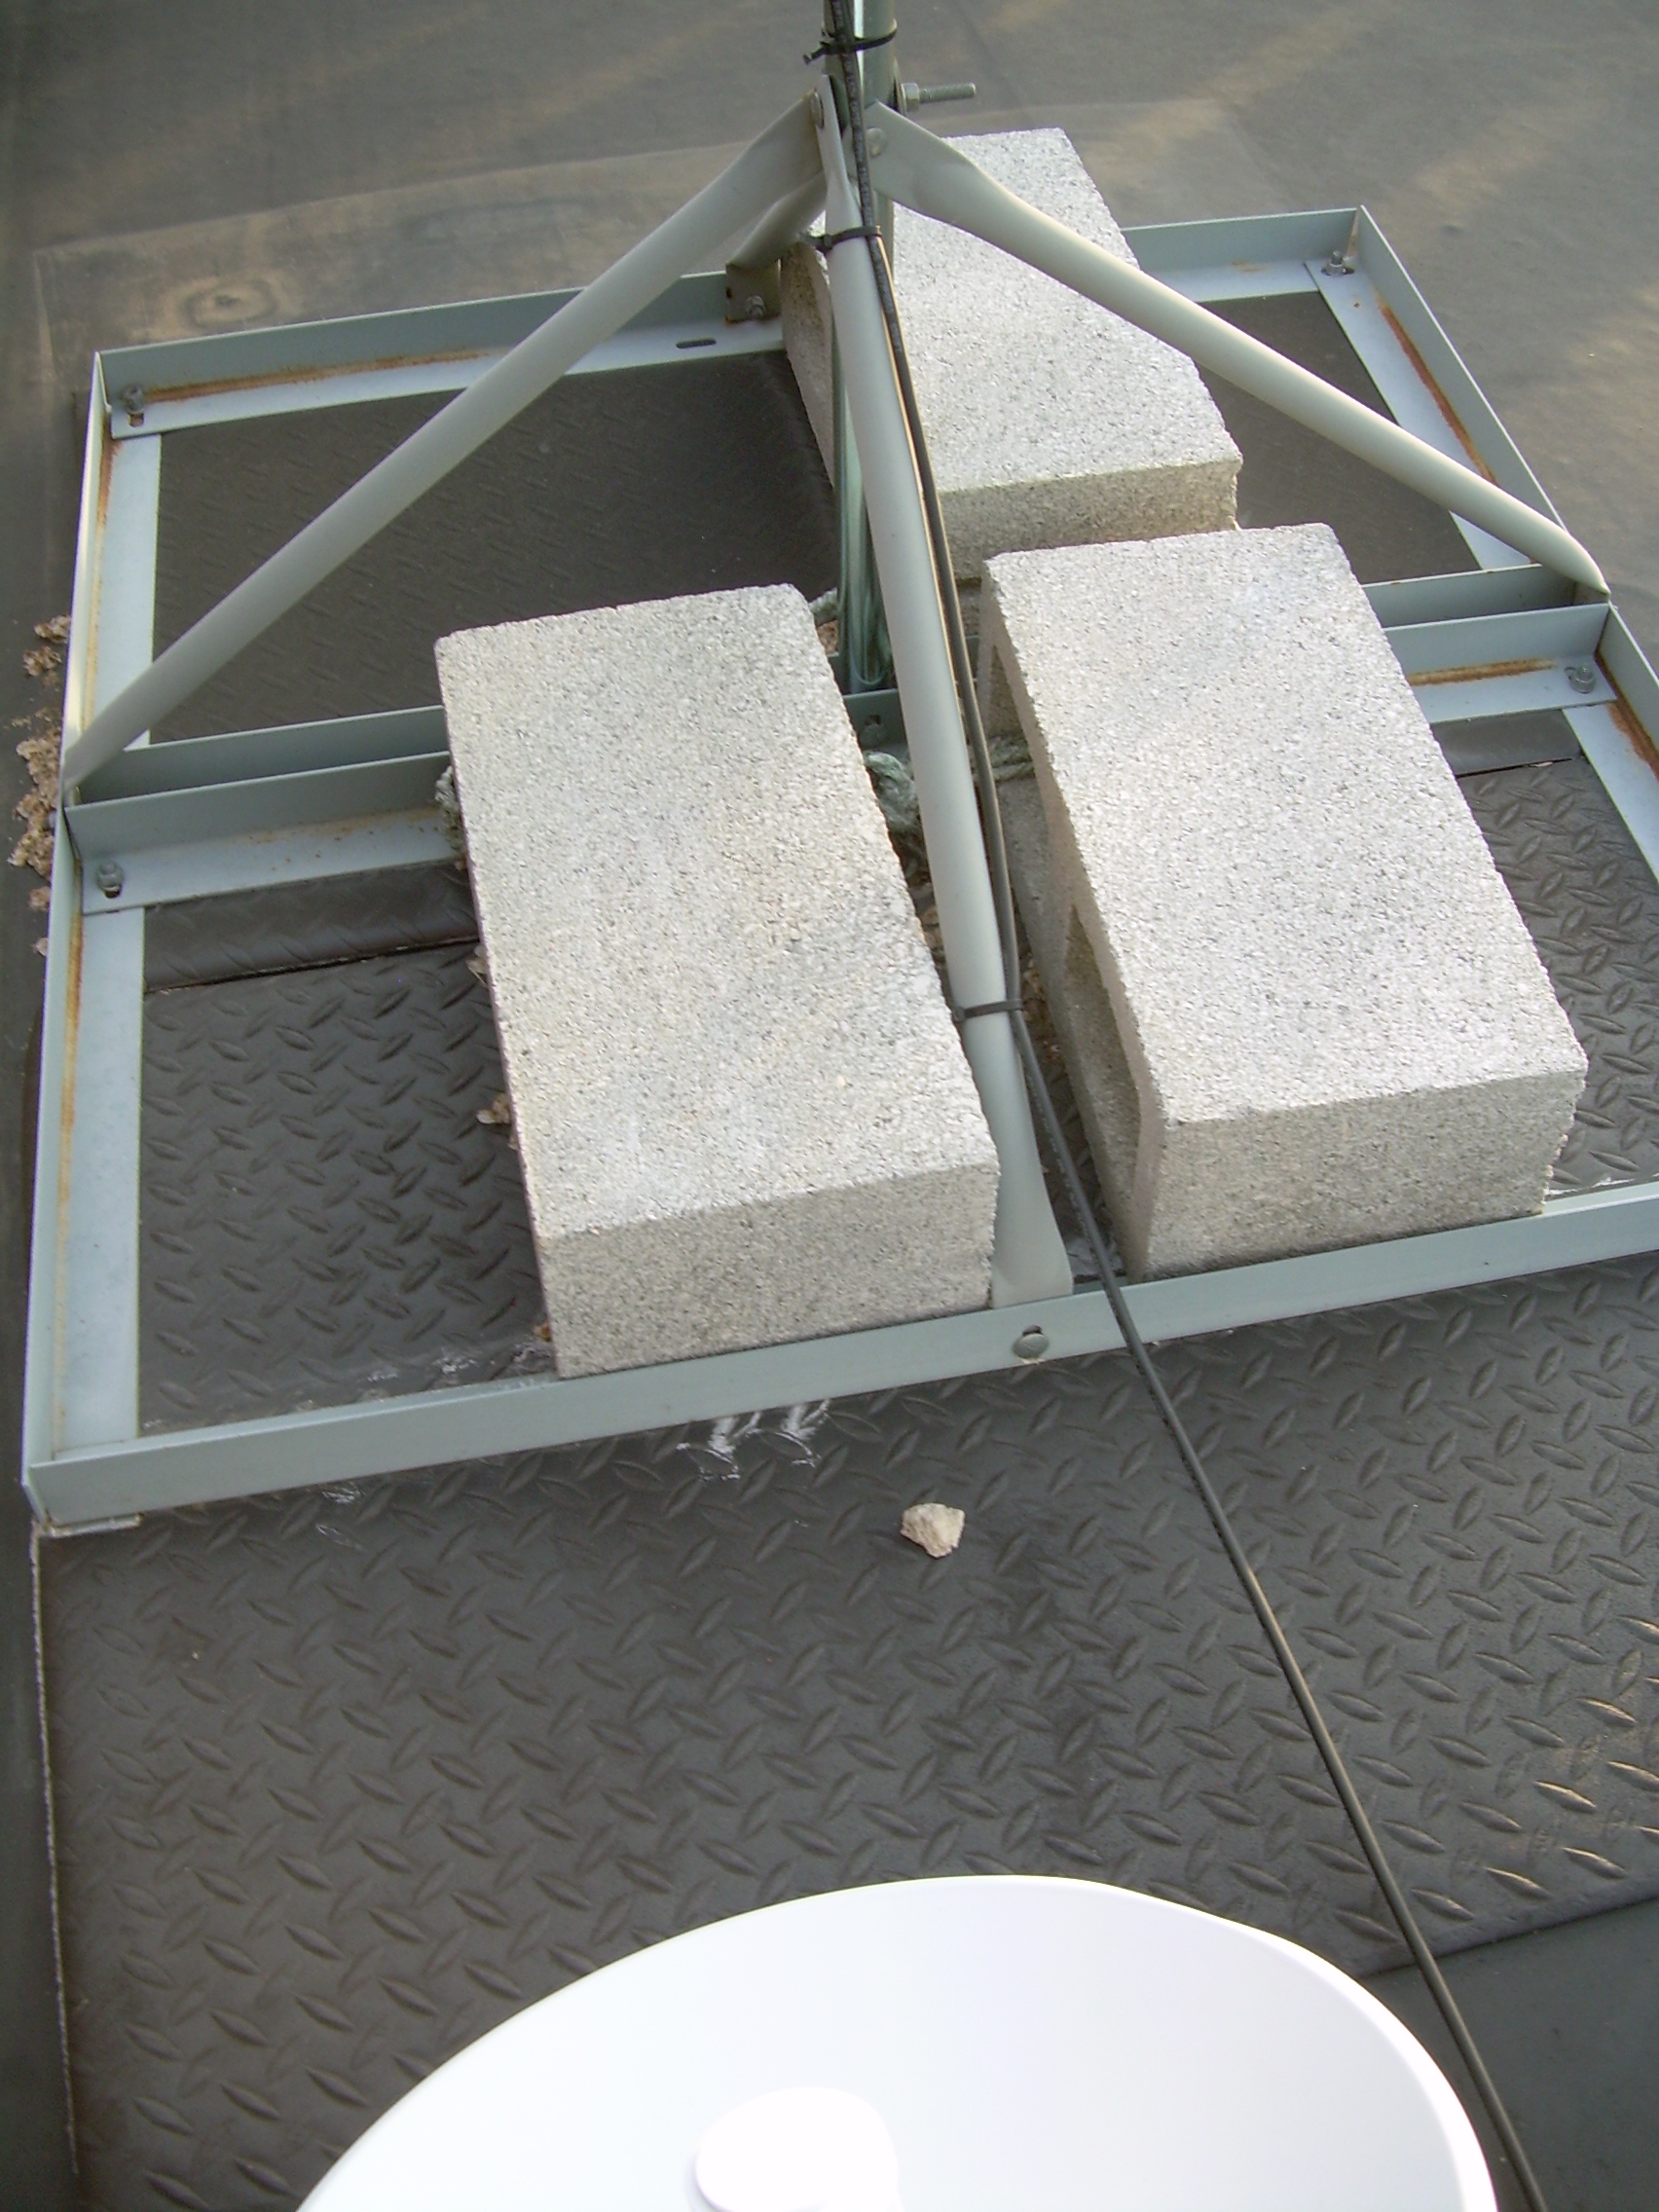
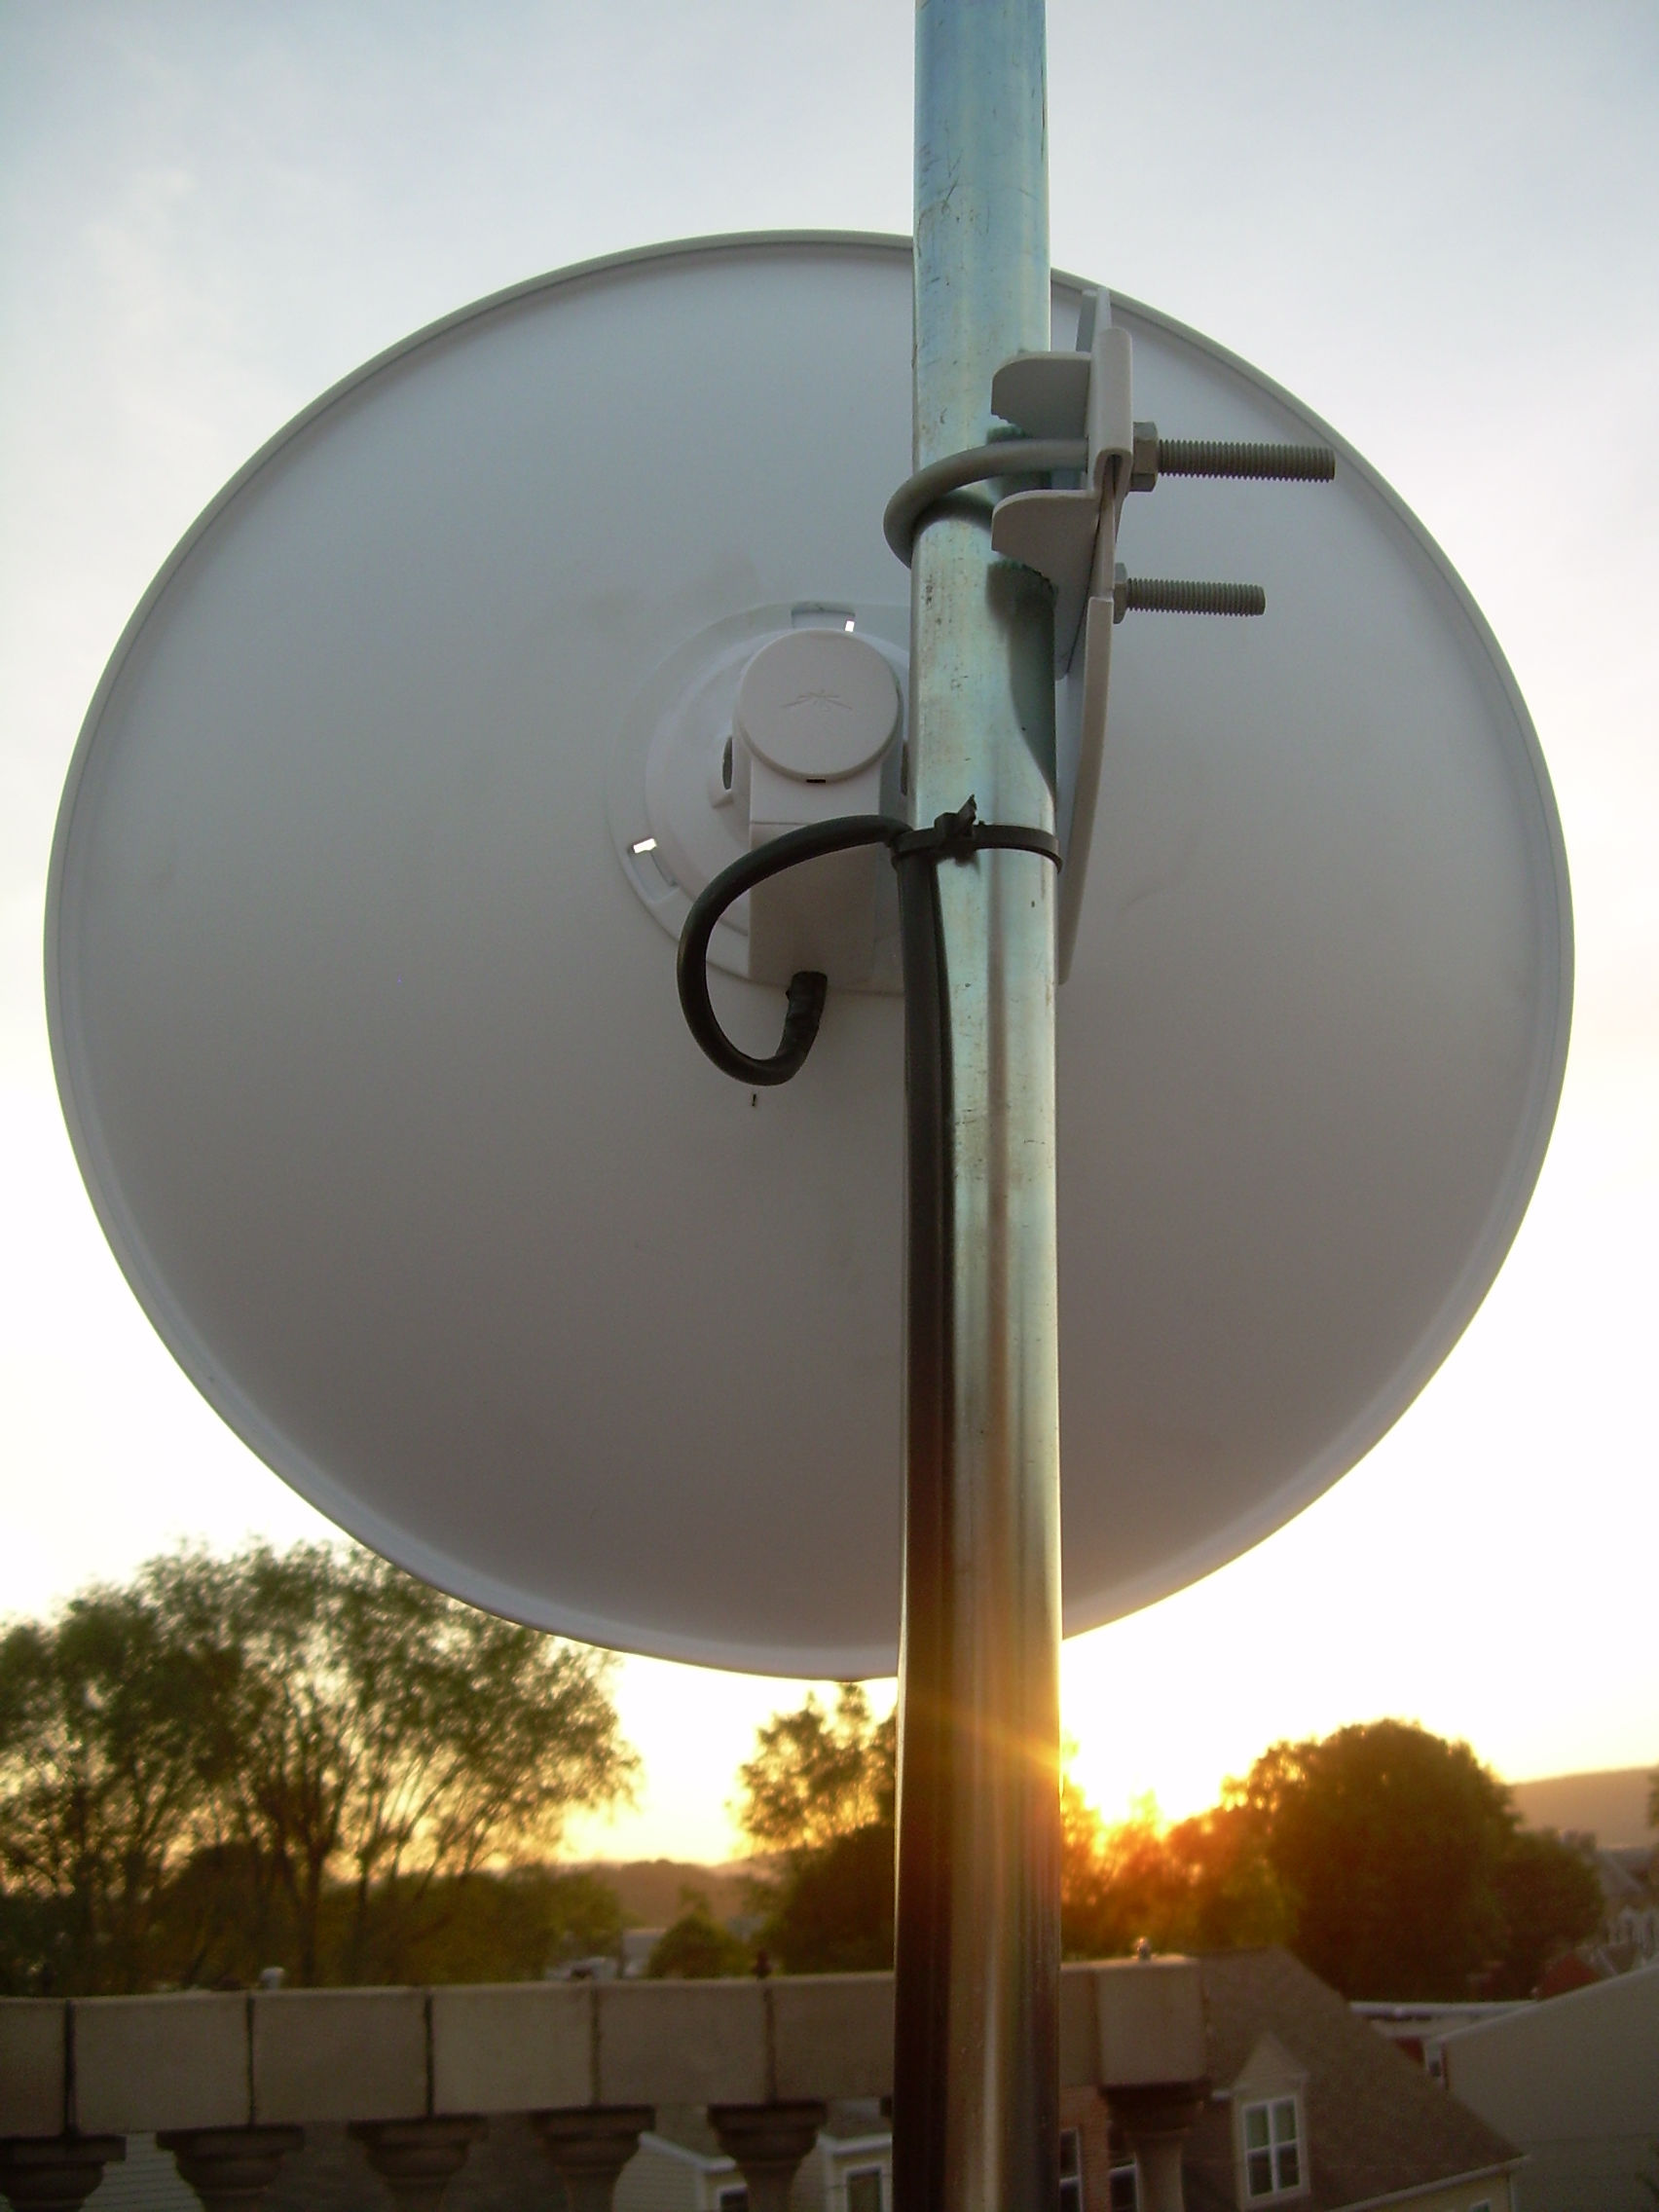
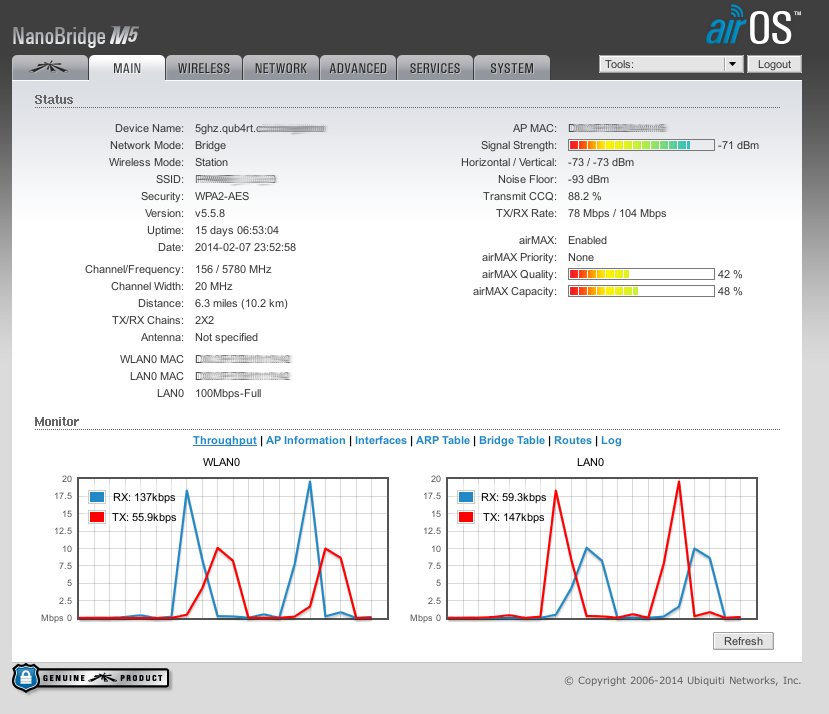
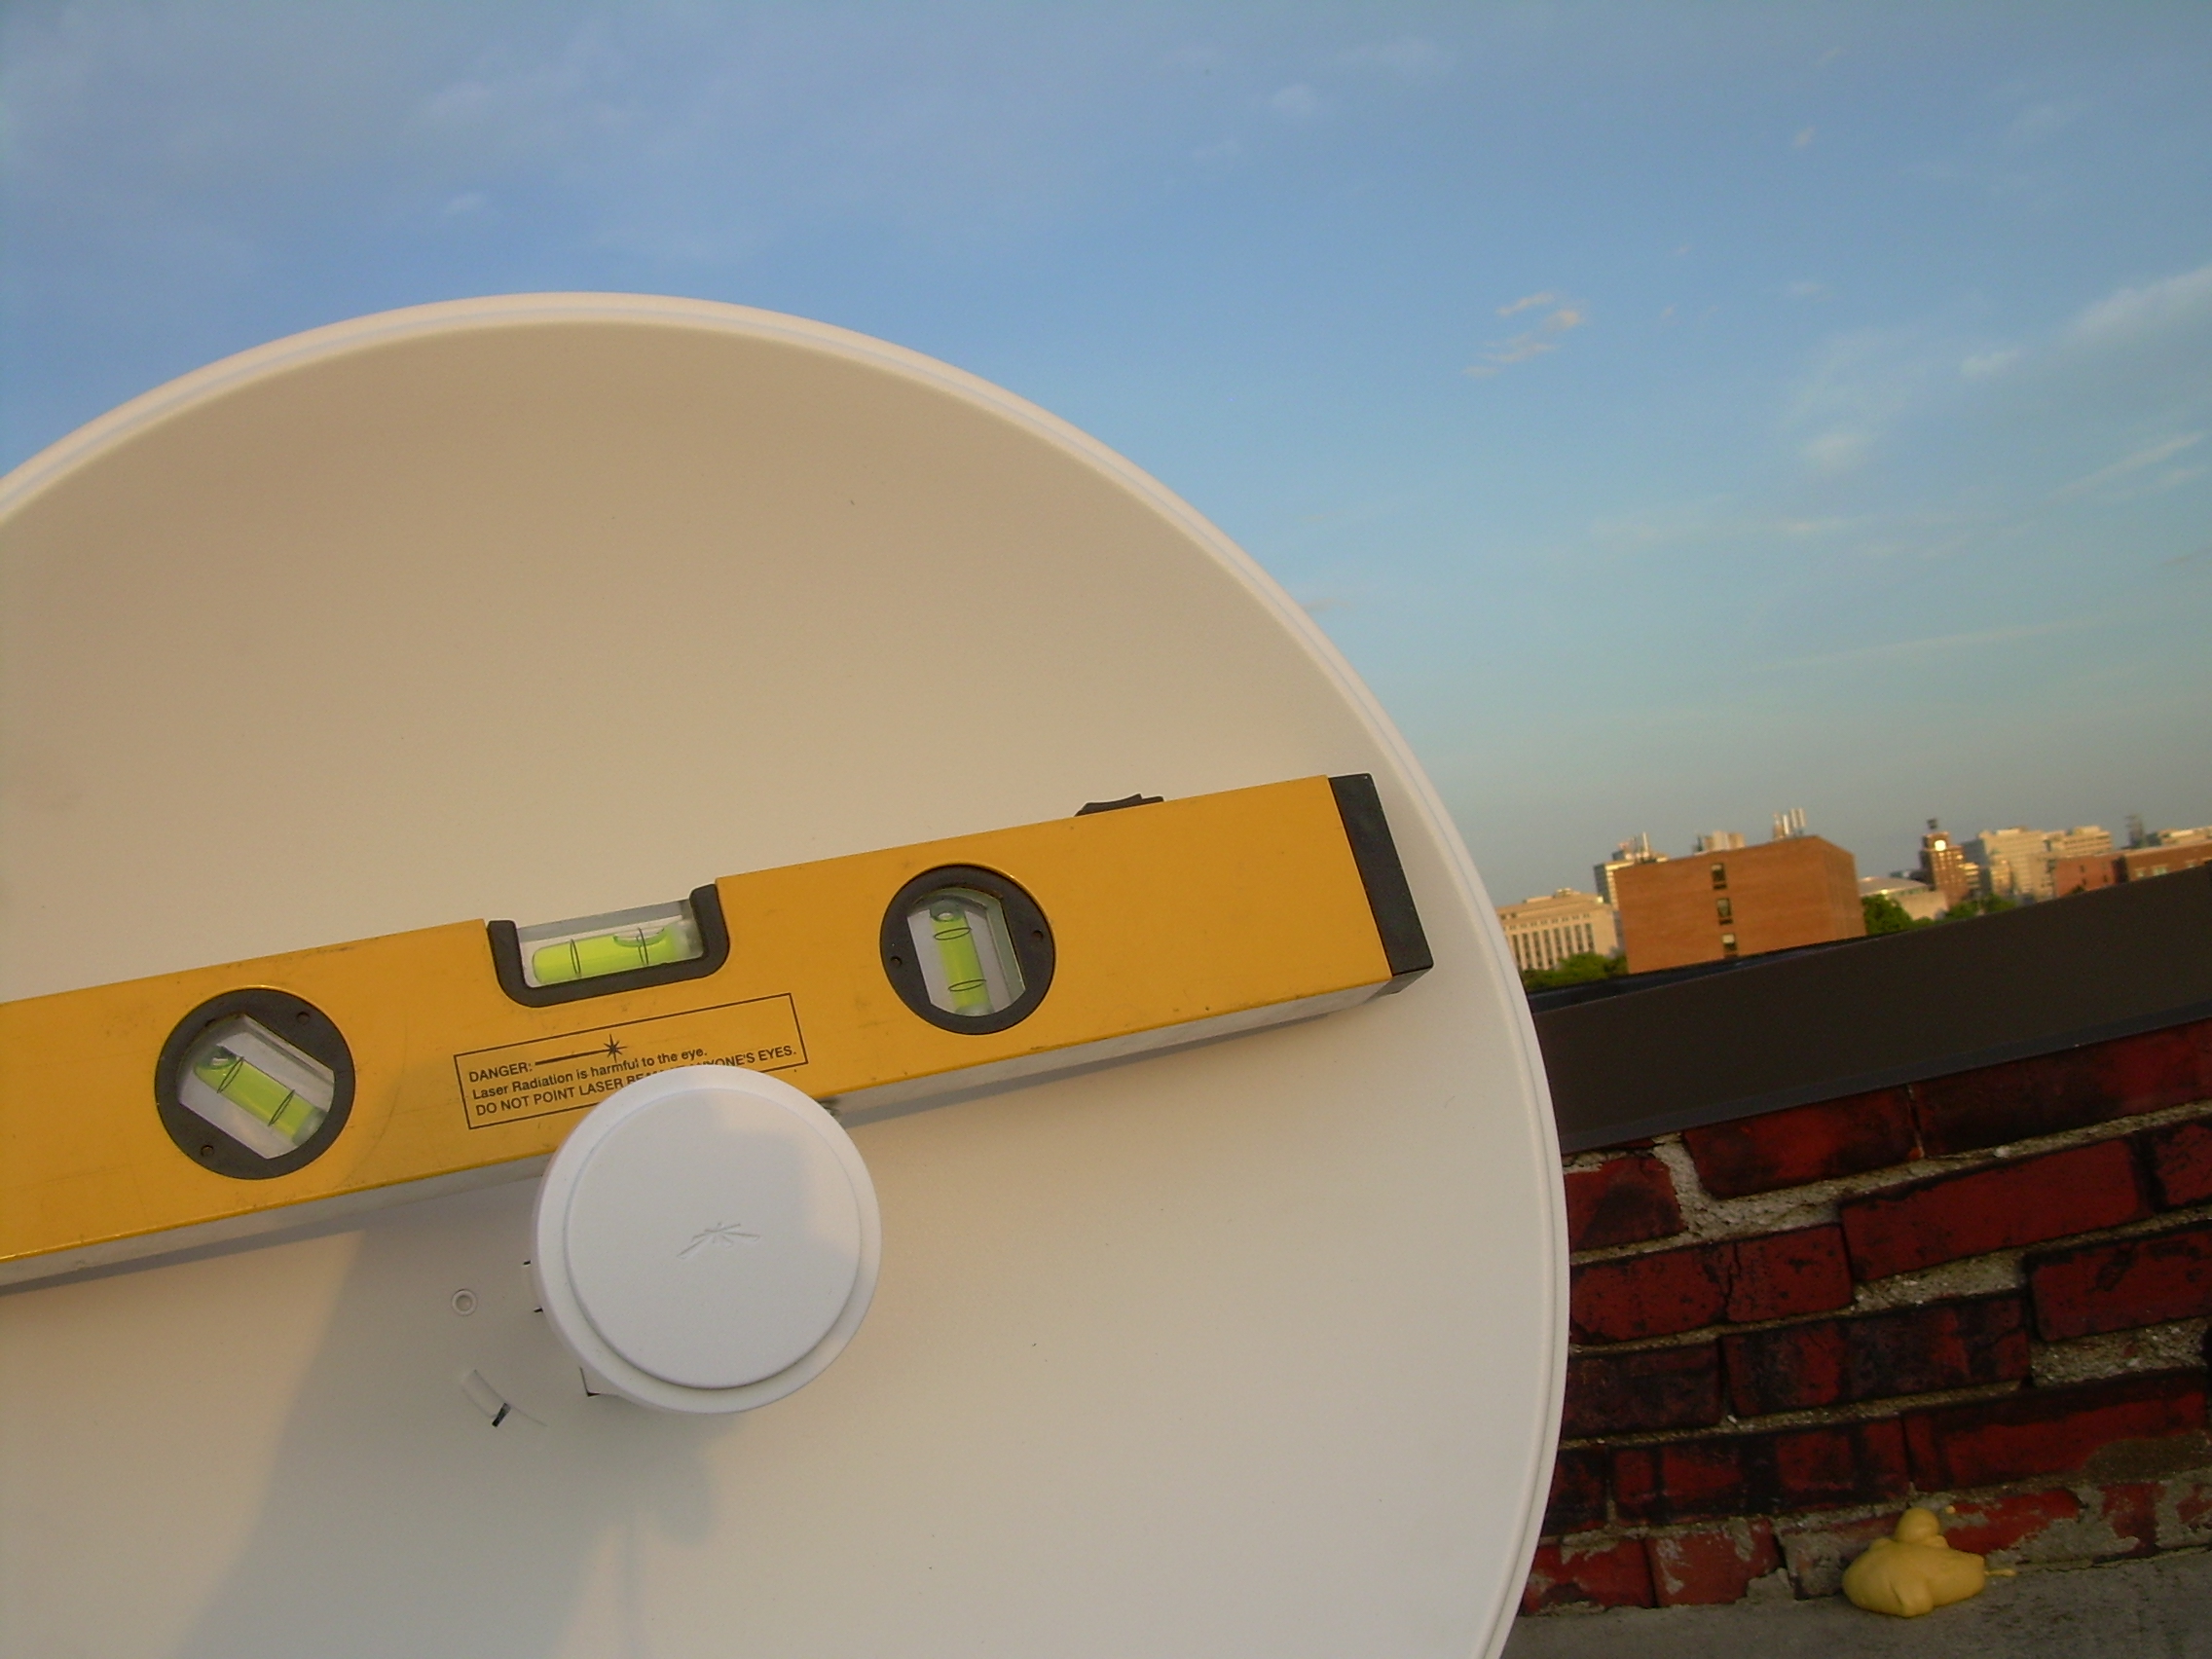
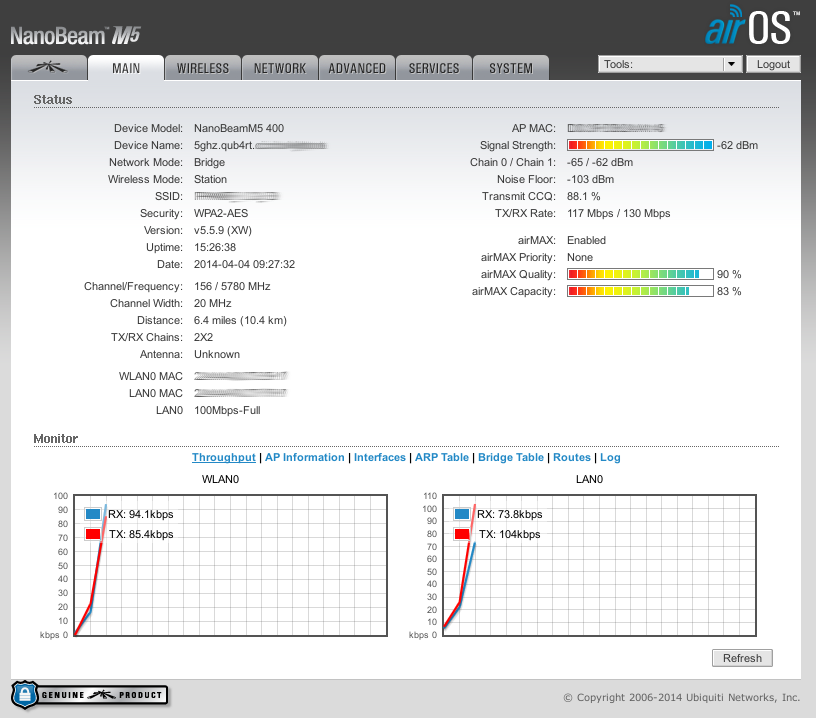
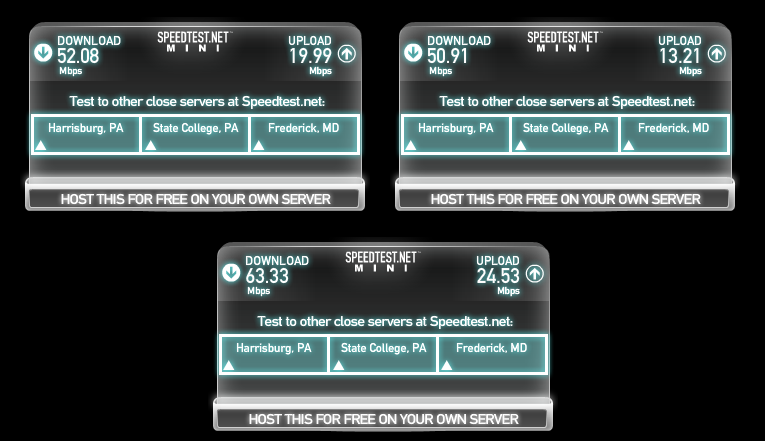
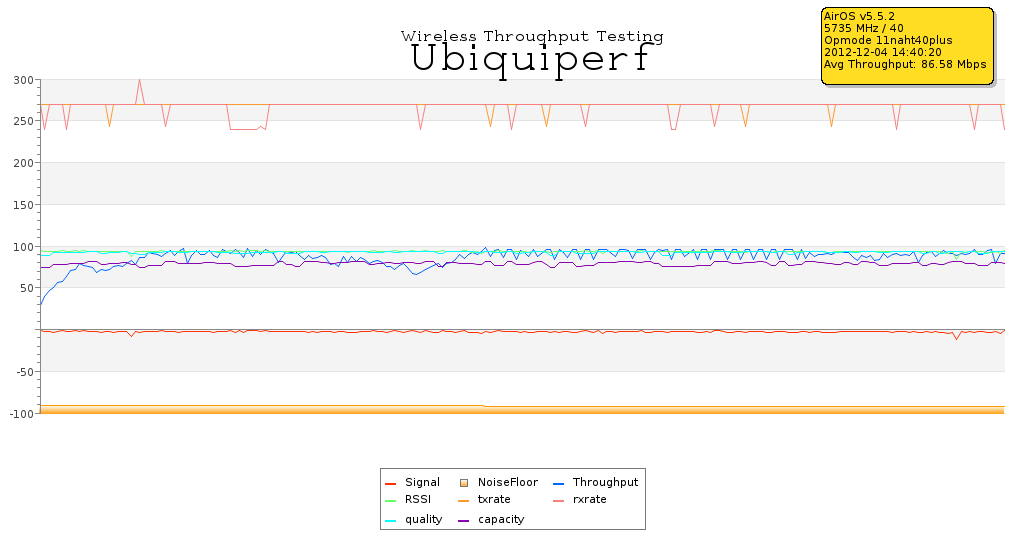
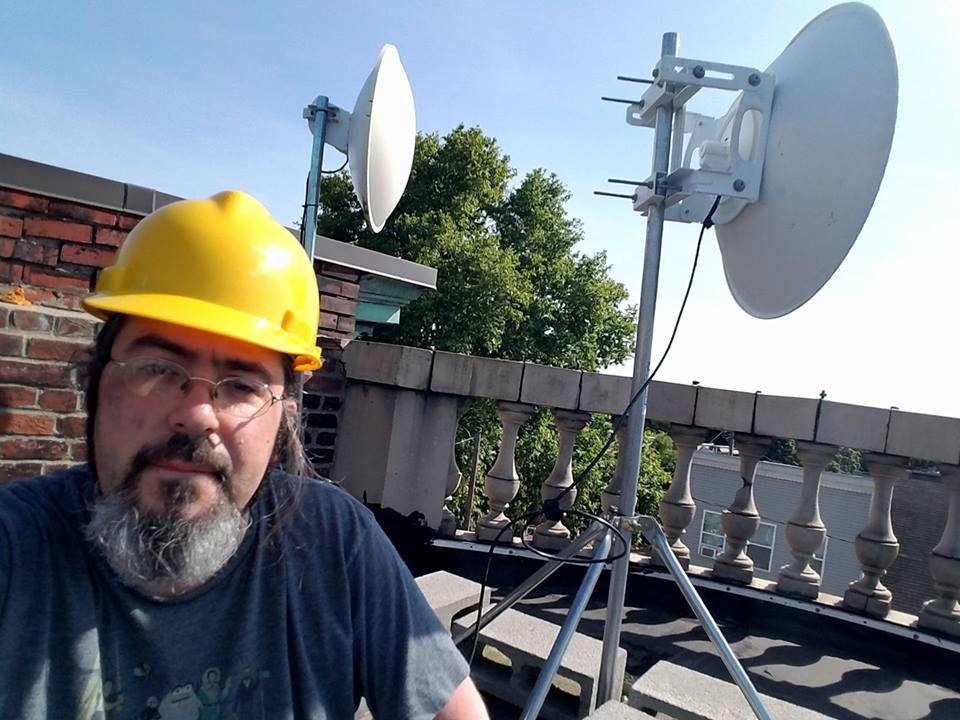
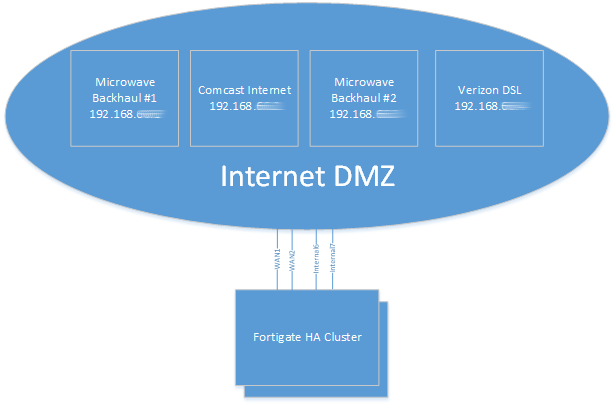
The home has 4 Internet connections with 2 diverse paths: The 3rd floor terminates two 5Ghz microwave PtMP links from a Wireless ISP that I used to work for. The basement terminates a Verizon 5Mbps/760Kbps DSL line, and a Comcast 100Mbps cable link.

Install large 3 foot dish while wife is busy, ask forgiveness later.

So how do I maintain connectivity to the Internet if a connection goes down or if I lose power on a floor of my home? Previously I had a simple VRRP setup: Whichever connection was performing best I would manually set to be the VRRP master and fail over if connectivity went down. If I wanted to specify that email should operate over the microwave backhauls, I would create another VRRP group (so that I could have redundancy), policy-based route email traffic to that group, and setup an IP SLA to test the connection. This was a bit of an administrative nightmare, so I did so sparingly.

Ubiquiti UNMS – a dashboard to view all of your Edge Routers

Then the world became abuzz with “Software Defined Wide Area Networking“. To qualify as “SD-WAN” Gartner has four required characteristics: The ability to support multiple connection types (MPLS, LTE, Internet, etc), support for dynamic path selection, load sharing over the links, and simplified provisioning (Zero Touch Provisioning).

I’ve had the opportunity to evaluate a small handful of “SD-WAN” solutions, each with their own pros and cons: Some are surprisingly lacking in features (despite large sales footprints), some are full of features but have lackluster provisioning, and some are insanely expensive (at least for home use).

Initially I had settled on adding a different vendor’s SD-WAN appliance into the home network and purchased 3 of their devices. After waiting for the shipment for over a month, I received a full refund from the seller with little explanation. I seriously lucked out.

Long wait, no explanation. Oh well…

While waiting for my boxes to arrive, I had the chance to borrow and test the platform and found some limitations – namely only support for 2 WAN connections and no active-active support (so I couldn’t use my other 2 WAN connections) . Then I took a closer look at the Fortigate’s I already had in my network.

Fortigate supports re-configuring each of their 10 ethernet connections for various use. This allowed me to take ports that are typically used for LAN connections and re-purpose them into WAN connections. This is a major plus. The downside was my exisiting Fortigate 60C’s don’t support the lastest FortiOS (6.0) code.

One of the 3 racks of equipment at home.

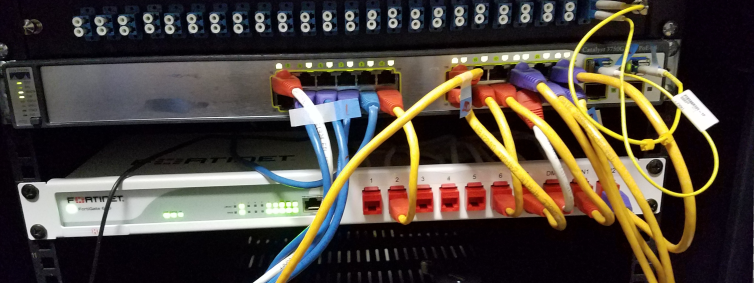
For the price of the other vendor’s limited platform (x3), I could purchase 2 used Fortigate 60D’s off Ebay – plus purchase rack-mount trays for each unit. No more Fortigate sitting atop another device in the network racks. Since I don’t need the advanced features the platform provides (anti-virus, IPS/IDS, etc), the second-hand solution is perfect for my needs (Firewall policies, SD-WAN, VPNs).

So here’s how Fortinet does things:

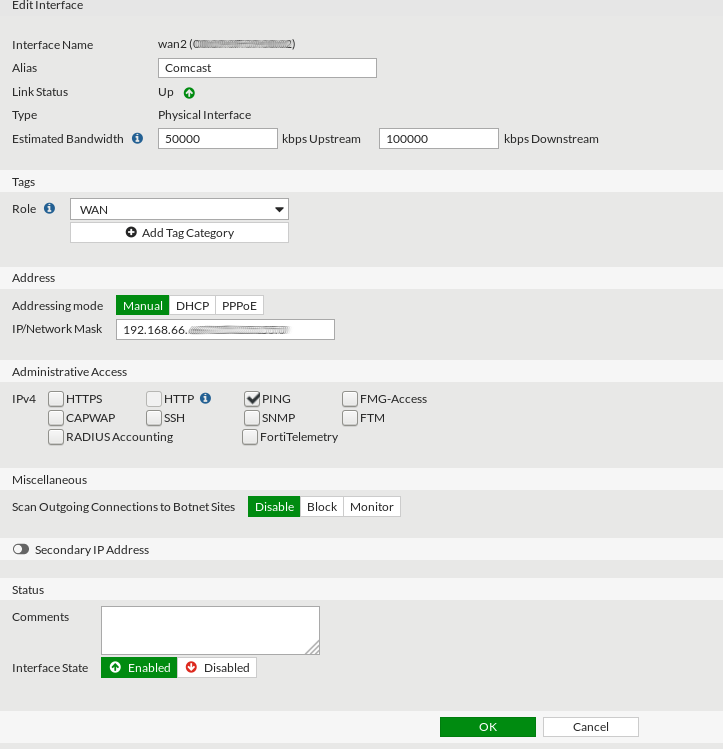
Configure an IP on each of the WAN connections you intend to use. In my instance, VLAN 66 is my “Internet DMZ” where each of the 4 Ubiquiti EdgeRouter X SFPs bring the Internet connections into my network.

To allow the Fortigate to have multiple WAN interfaces in the same subnet, you have to override the system default preventing that:

flamethrowerX # show system settings
config system settings
set inspection-mode flow
set allow-subnet-overlap enable
set gui-fortiextender-controller enable
end

When creating the WAN interfaces, you’ll need to manually specify the bandwidth of each link. This is one unfortunate downside to the Fortigate solution – it cannot measure available bandwidth dynamically.

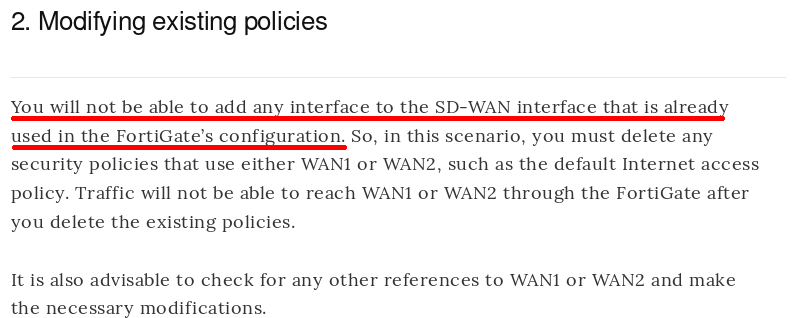
When selecting the members of the “SD-WAN” interface, you may find that you’re unable to include certain interfaces. The most likely cause of this is a firewall policy referencing that interface. If you don’t follow the cookbook, you’ll likely run into this frustrating problem, so RTFM.

Oh… so that’s why I couldn’t do that… Hmm…

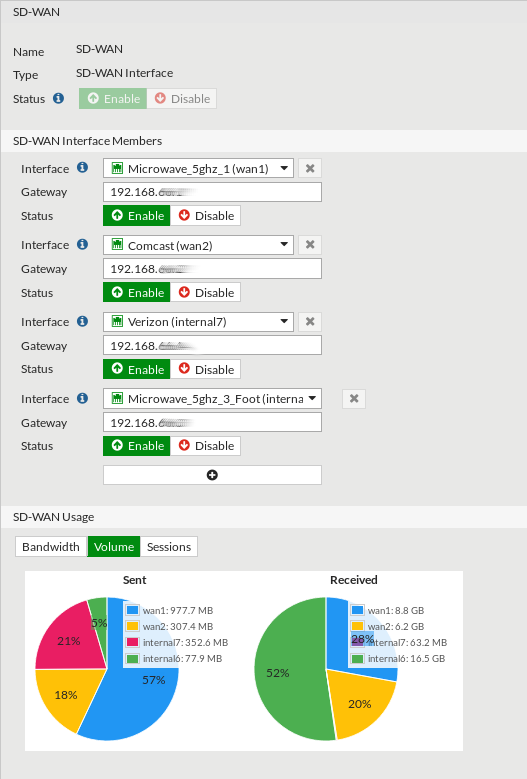
When you aggregate interfaces into the SD-WAN interface, you’ll need to specify the gateway of each WAN link and the default load-balancing mechanism. In my instance I’m using “Volume-based” balancing.

Defining the pie.


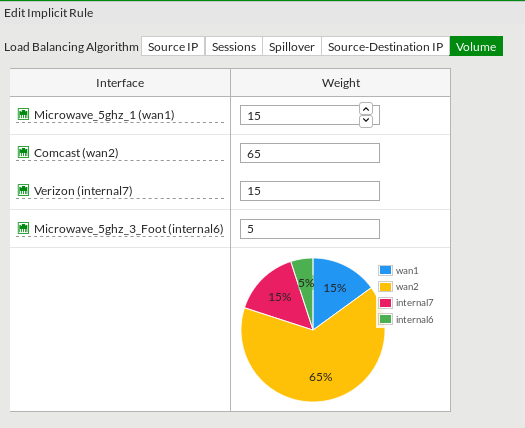
Under the SD-WAN rules section you can further specify how you want the volume dispersed.

Slicing up the pie.

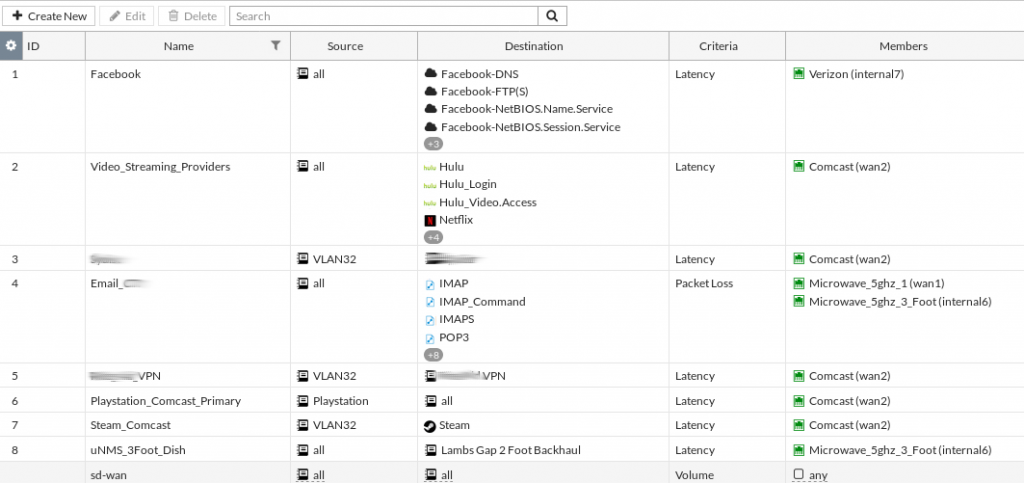
After creating the base settings you can have the real fun. The PBR rules that used to take additional thought and design are now the matter of a point and click solution. Making email route over the 5Ghz links by default is the simple matter of creating an SD-WAN rule. Video streaming services such as NetFlix and Hulu can simply be prioritized to run over the higher bandwidth cable connection – and failover to the other options when needed.

This is WAYYYY easier than the old way of doing things.

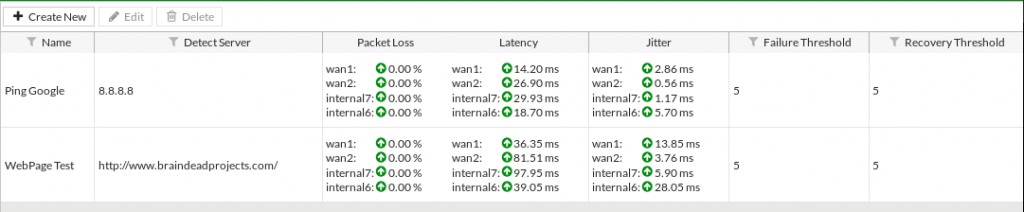
The SD-WAN SLA’s are somewhat simplistic. You have the option to either ping or pull a web request from a designated server. Neither solution detects MTU issues in a path. If I were to disable TCP MSS clamping on my DSL line the system continues to use it despite a user being unable to download content from websites correctly.

The SD-WAN SLA’s. Pingy, pingy, pingy, pingy, pingy.

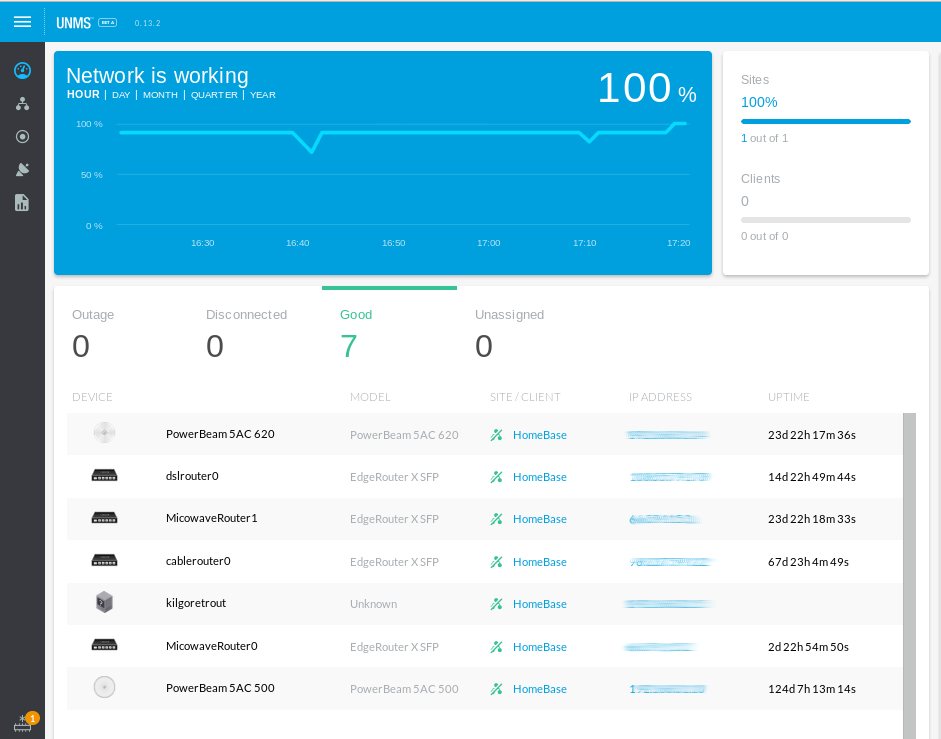
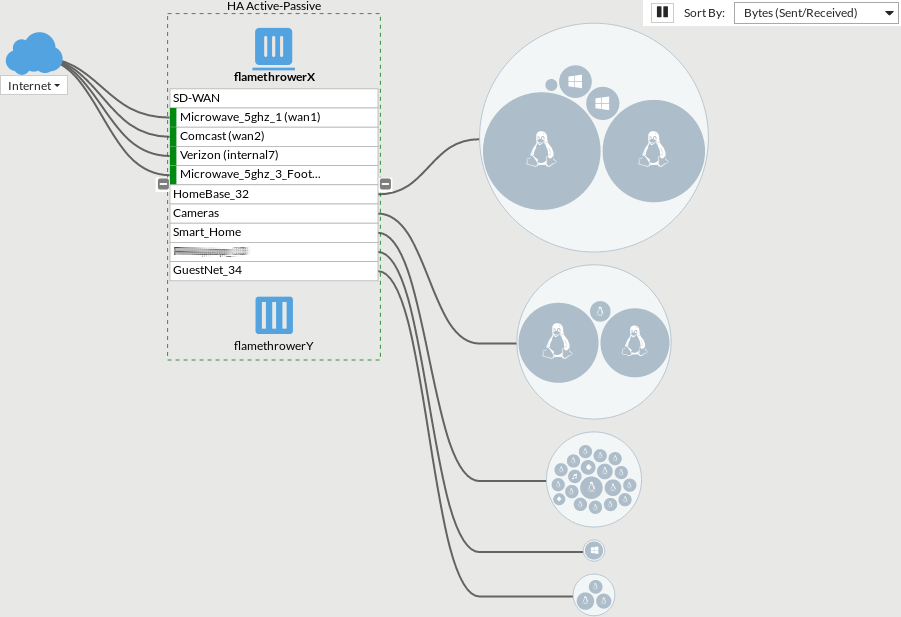
One of my favorite features in the web interface is the ability to look at the logical topology and see which users in each VLAN are consuming what amount of traffic.

Lots of penguins heading to the cloud.

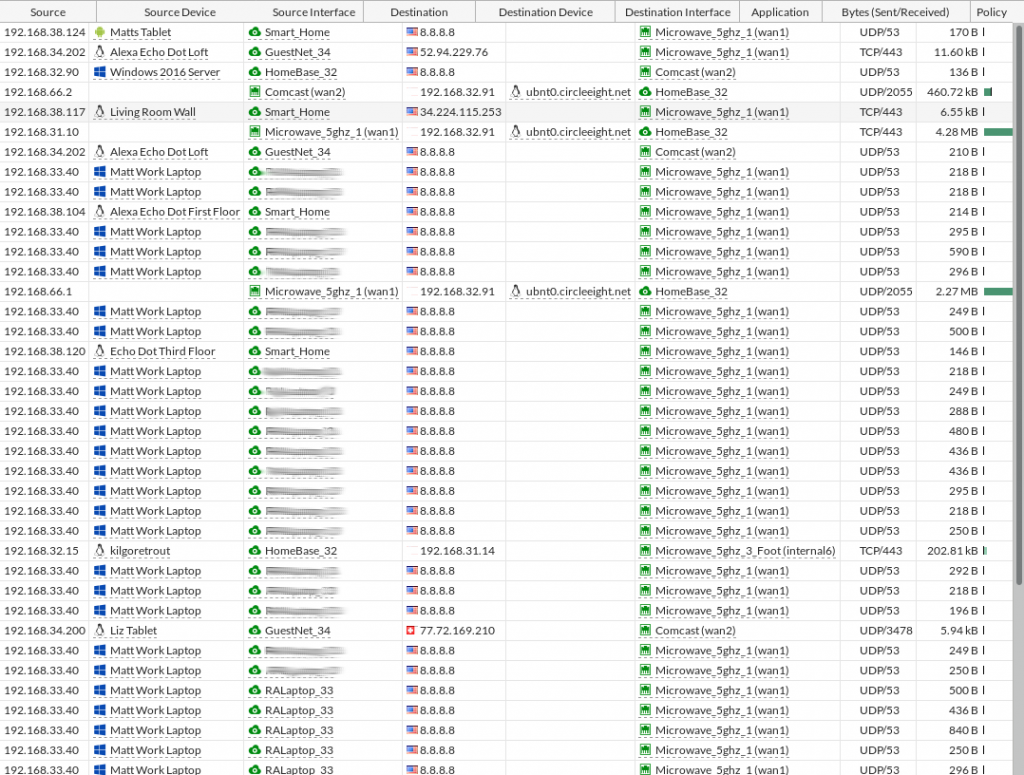
You can also drill into the flows determining which flow is using which WAN link.

You go this way, you go that way, you go this way, you go that way.

So, what do I not like about the solution? I’m able to rename an interface, but on some screens the GUI displays the interface name and NOT the alias. This requires additional thought “Oh, interface7 is the DSL”.

I also wish I had the ability in each flow to see which SD-WAN rule was hit. This is important since it can help you verify that things like Email are classified correctly (I found that IMAP wasn’t considered part of the “All Email” out-of-the box classification in the non-Fortinet solution I initially purchased).

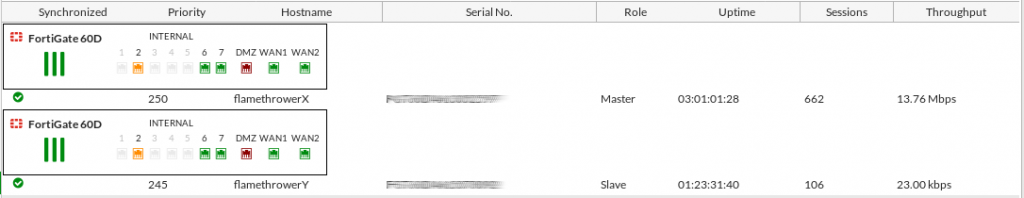
I’m still working to perfect the HA failover on the system. The general idea is that if the one Fortigate can’t ping the VRRP addresses I had setup on the WAN routers or LAN switches the backup unit should take over. “Remote Link Monitoring” took me some time to get working on the former Fortigate 60C’s, so I’m not discouraged yet.

High Availability: When you need a backup flamethrower.

Overall you can certainly see the power of what Fortinet’s re-branded “WAN Link Load-balancing” has to offer. The ability to leverage redundant Internet links in such a simple manner places some serious power in the hands of companies with limited IT resources – and I’m only scratching the surface of the capabilities.

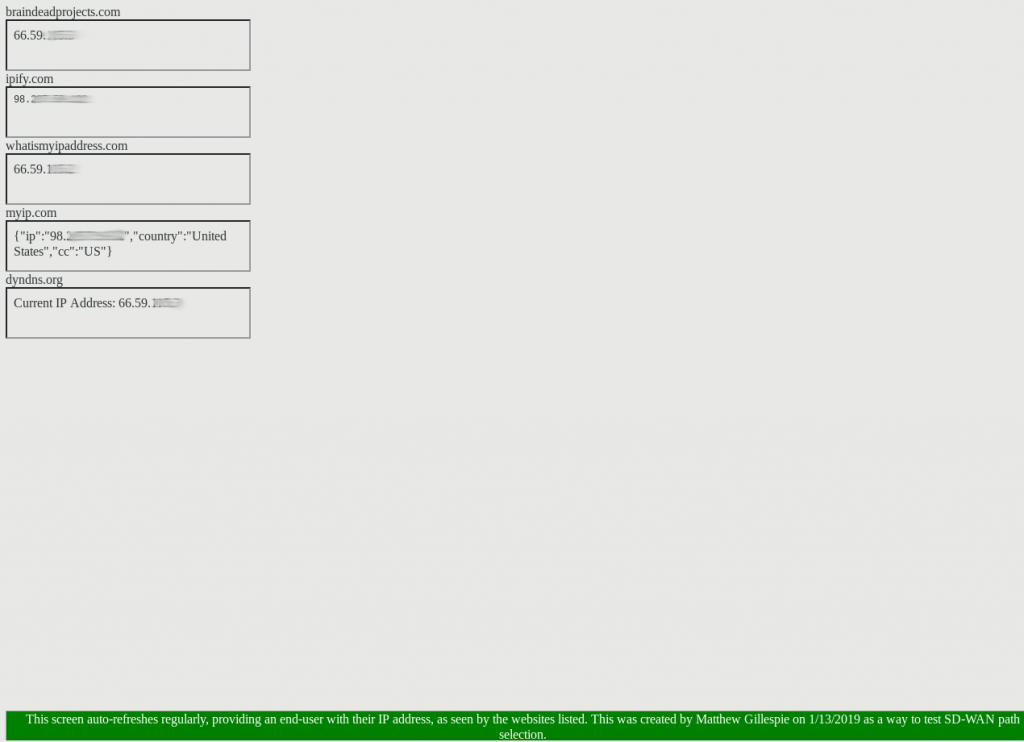
If you’re looking to test your own WAN load balancing, I’ve put together a webpage that will display your IP address, as seen from 5 different IP lookup sites on the Internet. Feel free to use it for testing. You can find it here.

The Sunset on Lambs Gap

A couple of months ago, I started to notice a few issues when watching YouTube videos at my home.  It seemed that the videos were taking longer to buffer, and a quick check of my Ubiquiti NanoBridge M5 (NMB5-25) revealed my signal had deteriorated from it’s usual -64dBm signal to around -75dBm. The Airmax Quality had also significantly tanked, now reading around 40%. An Airview scan didn’t seem to indicate any new interference:

Airview Before
The Access Point is in use.

Throughput tests to two on-network Speedtest.net Mini sites still showed decent rates, but it became obvious that TCP retransmissions were starting to significantly impact surfing the web. Unfortunately, I didn’t think to grab a tcpdump to support that theory.

Before Speedtest
Decent Throughput it would seem

I had been holding off installing the new NanoBeam M5 (NBE-M5-400) since I wanted to ensure they were stable. While I’ve not been burned by the problems with ToughCable or chain burnout problems on the Rocket Titanium M5’s, I’ve heard my fair share of grumbling from people that have. On the Ubiquiti forum people have mostly raved about the new units so I figured I’d see how well it performs.

On the roof of my home, I have a non-penetrating mount atop two anti-fatigue mats purchased from the Home Depot. The mats aren’t UV rated, something I didn’t consider until later. After a yearlong installation, the mats are in surprisingly good shape. I don’t anticipate having to replace them in the next two years based on their current wear.

The Mount.
Carrying 3 of these up a ladder makes you sleepy… that’s why there’s no fourth.

The NanoBridge M5 dish itself was still tightly connected to it’s mast, and the 3 concrete ballasts holding the mount in place seem to prevent any possible shifting.  Initially when my signal deteriorated, I thought a bird may have slammed into the dish or mount and somehow moved it, but I don’t believe this is the case. The more likely culprit is a tree.

Tree Clipping
A view from behind the new NanoBeam — I’m fairly certain I’m clipping the tree on the right.

Hey What's That Picture
Courtesy of heywhatsthat.com – the line to the tower.

I knew when I installed the link that it was very likely clipping the tree on the right. Our tower is slightly to the right of the valley.  Not particularly liking heights and trying to limit visibility from the street, I opted not to move the mount closer to the front of my home.  I may revisit that decision in the future. Before I removed the NanoBridge I did try to correct it’s position but was only able to receive around an average of -70dBm at best.

The NanoBridge M5
This is about where my signal settled.

Losing sunlight, I upgraded the dish to the NanoBeam M5. The only thing about the dish I dislike is that it has one U-bolt instead of two. I’m sure it’s ample but the NanoBridge’s 2 U-bolt configuration really seemed to hold it to the pole so that it couldn’t possibly be knocked out of alignment. My roof is mostly flat with a slight angle, so I wasn’t able to fully straighten the dish.

The Level
Do Not Point the Laser into Someone’s Eyes.

Installing the NanoBeam was quick and easy. The first thing that was obvious was the noise floor had gone from -93dBm to -103dBm. The signal was significantly improved, now running in the -63dBm range, and overall stats were a remarkable improvement over the NanoBridge.

NanoBeam Stats
A bit of a difference


Post Upgrade Speedtests
Zrrrrrrrrrroooooomm!

The week before I performed the upgrade, I finally added the Ubiquiti radio to my home Cacti installation. Forgive the ugly colors of the graphs (I plan of making them more visually appealing one day), but as Adam Savage says “The only difference between screwing around and science is writing it down“.  These graphs display a pretty clean-cut before and after of the upgrade, which took place at about 20:00.

Frequency in Use
I didn’t change frequencies, but here’s a graph.

Mo Memory
The NanoBeam has more memory than the NanoBridge.

CCQ
Client Connection Quality (not much of a change here)

Signal Graph
The signal is substantially improved.

Data Rates
My data rates improved.

I incorrectly saved the Airmax graph after the upgrade and only noticed the next day (that’s why this graph is hours after the others).

Airmax
Much better Airmax Quality.

I’m extremely pleased with the upgrade. My initial problems with YouTube buffering have gone away and three days later things are still going strong. In the end I had a chance to see a pretty cool sunset on Lambs Gap.

SunsetOnLambsGap
The Sunset on Lambs Gap

Wireless Iperf Graphing – Part Two

After dusting off the old source for my previous post, I started realizing one of the main limitations to Ubiquiperf — the results aren’t displayed real-time.  If they were, one could easily move radios around and see the impact almost instantly. This got me thinking, and not having worked in Java for a while I knew what to do: Fork JPerf and get to work:

Announcing: UbiquiJPerf

It’s got a long way to go, and comments/suggestions are always welcome. Source (including a pre-compiled .jar) are available at github.

Wireless Iperf Graphing

About a year ago, we were doing some wireless throughput/interference testing at the office  to acclamate ourselves to the wireless world. Most importantly, we were trying to answer the question “Why can’t I just lease a 10 foot section on a tower and  install a zillion radios there?”

Despite having a handful of BCP design documents at hand, as well as input from established and respected members of the wireless community, the question kept seeming to pop up. So how does one present a worthwhile answer?

My solution was to build a small section of a tower leg on our back lot using a non-penetrating roof mount, 2 Ubiquiti Rocket M5 90 5G-20-90 degree sectors (mounted 90 degrees from each other, without shielding), 2 Nanostion M5 CPE’s, 4 laptops, and a couple of inverters and car batteries to power 2 of the laptops (the other 2 were run off extension cables).  The two laptops connected at the Access Point side ran as Iperf servers, each laptop ran as a client.

UbiquiperfLayout
Plug this in here, that in over there, and this cable.. here.

The thought was to grab Iperf and AirOS datapoints at every couple of seconds  and see “what happens when I do this?” “THIS ” generally entailed doing something BCPs warned against doing.

To gather the Iperf data and AirOS statistics, I put together a quick script i called “Ubiquiperf“. Basically it polls an iperf test every second, pulls the stats off the radio (Capacity, Quality, RSSI, etc) , generates a CSV file of all the data, and finally creates a graph using the jpgraph PHP libraries.

Due to weather conditions our testing was cut short and our initial results had a simple problem: we needed to turn the transmit power down on all the radios.

For a baseline, we performed a quick throughput test one at a time, where each Access Point operating on the same frequency could perform at about 85Mbps:

ap1-test1
AP1 Baseline

ap2-test1
AP2 Baseline

So what happens if I perform the same throughput test on both units but at the exact same time, over a longer duration?

ap1-test2
AP1 concurrent iperf test

ap2-test2
AP2 concurrent iperf

Well, it obviously cut off about 20Mbps from the first access point. Of course, the power on the radios really needs to be turned down so this test is unfortunately not worth much. We’ll be doing additional testing in the near future, and hope to have meaningful results that include mounts with and without RF Armor, Titanium model equipment, etc. I’ll publish our results when I can.

In the meantime, feel free to play with it yourself. Full PHP source is available on GitHub.